Up to 50% OFF
What Can I Customize?
A pictograph is a simple data visualization that uses repeated icons to represent quantities. PresenterMedia pictographs are fully editable graphics you can customize online and download as high-quality images for slides, documents, or the web.
Open the online editor to edit values, labels, and text. Choose your icon style, adjust colors or layout, and when finished, click the Build and Download button to generate your customized image.
Yes. Select an icon set and click Edit. Under the Format Pictograph panel, use the paintbrush tool to adjust icon colors. You can also control how many icons are filled to reflect your values.
Absolutely. Update the quantities, click Update, and the pictograph will instantly adjust to match your changes.
Your customized pictograph downloads as a high-resolution PNG images. Perfect for use in presentations, documents, websites, or print.
Yes. Simply insert the PNG image into any slide like a regular picture. It scales cleanly and displays exactly as designed.
A limited selection is available for free. Full access to all pictographs and advanced customization features is included with a PresenterMedia Unlimited Plan Subscription.
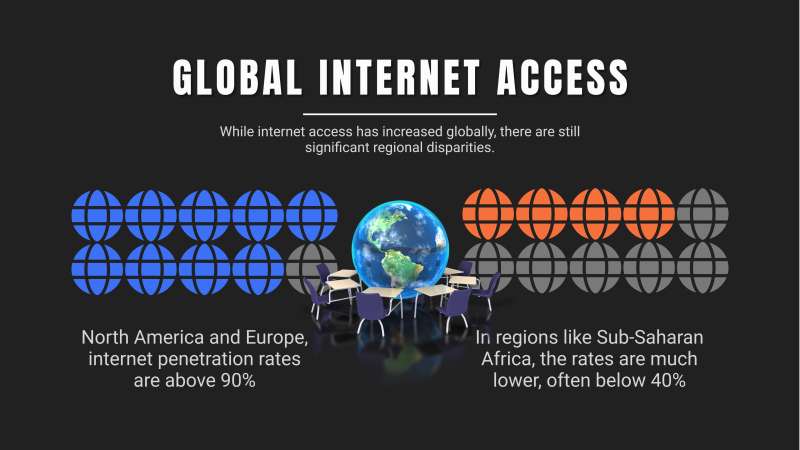
This editable pictograph template features the title "GLOBAL INTERNET ACCESS" in bold white letters at the top, with a subtitle stating, "While internet access has improved globally, there are still significant regional disparities." Below this text is a visual representation of internet access across different regions, depicted by rows of icons resembling people. The icons are color-coded: blue for North America and Europe, where internet penetration rates are above 90%, and orange for regions like Sub-Saharan Africa, where rates are often below 40%.
This pictograph depicts the concept of global internet access, highlighting the disparity between different regions. It visually emphasizes that while some areas enjoy high connectivity, others lag significantly behind. This inequality in digital inclusion can have profound implications for economic opportunities, education, and social mobility.
By clicking the Customize This Item button above, you can change text, add an image, delete elements, or access the pictograph editor to change the icons, add or decrease icons, and change the layout.
This image represents not only the technology behind global internet access but also the varying levels of accessibility worldwide. The use of color-coded icons serves as a stark visual contrast between regions with high and low connectivity. It underscores how technological advancements have been unevenly distributed globally. This pictograph also suggests that while progress has been made in expanding digital networks, much work remains to bridge the digital divide. Furthermore, it implies that access to information technology is crucial for participation in the modern economy.
Adding this clipart image to a slide in one of our PowerPoint templates can create a visual focal point to accompany the presentation slide message. It helps to break up text-heavy slides and provides a clear visual representation of data, making your presentation more engaging and easier for your audience to understand.
This image's transparent PNG background makes it highly versatile for media design projects. By clicking on the background layer's visibility in the layers tab, designers can seamlessly integrate this pictograph into various compositions without any background clash. This flexibility allows creative freedom in designing visually appealing and contextually relevant media.
You can find many more standout Pictographs for visual aids. These pictographs can enhance your presentations by providing clear and concise visual data. They are designed to be easily integrated into various presentation formats, making them a versatile tool for any presenter.
pictograph global internet access connectivity digital inclusion
Similar Templates and Designs
© 2009-2025 Eclipse Digital Imaging, Inc.
Quality PowerPoint Templates, Animations, videos, and 3D Clipart.
PowerPoint® is a registered trademark
of Microsoft Corporation.