X

A pictograph infographic displaying lightbulb and question mark icons with the word 60% and text next to them.

Pictograph & Infographic Templates

Get Started with Free Pictographs! — No Sign-up Required!

Customize or download pictographs below or unlock thousands more designs with our Unlimited Plan

Whether you’re an educator, marketer, or business professional, our pictograph templates make it simple to create captivating and memorable infographics. With easy customization, you can engage your audience like never before.

What are pictographs and how do I use them in PowerPoint?

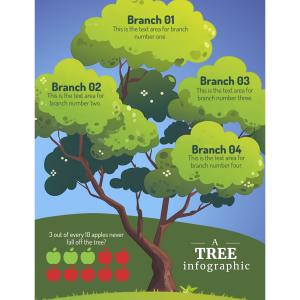
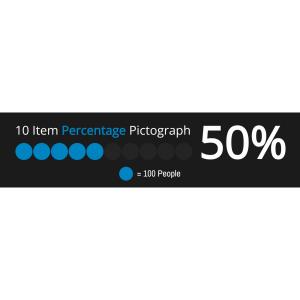
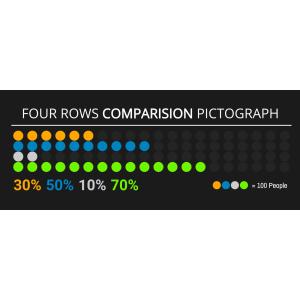
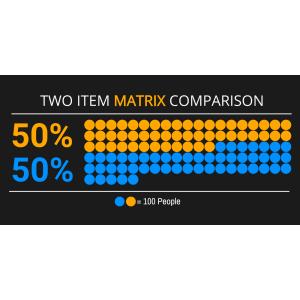
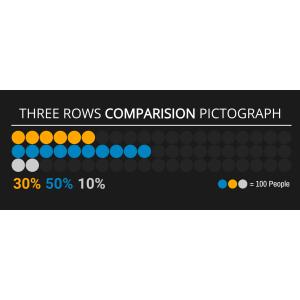
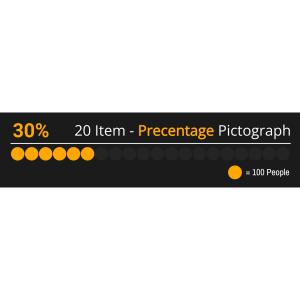
Pictographs are visual charts that use icons or symbols to represent data. They're perfect for presentations where you want to simplify complex statistics or highlight comparisons in a visual and engaging way. With our pictograph builder, you can customize the icons, values, colors, and layout to match your topic and style.

Once created, pictographs can be downloaded as transparent PNG images or inserted into your PowerPoint templates and Google Slides. They're a great way to make data-driven content more digestible and memorable for your audience.

Pictographs are included with your PresenterMedia Unlimited Access Membership. Start building your own visual data graphics now—no design experience needed.

Edit our pictograph and infographic templates to start building standout visuals for PowerPoint, Google Slides, and media projects.

Download or customize this pictograph showcasing educational achievement using graduation caps, effectively communicating statistical data visually.
Fun Fact Pictograph Template
Presentation Clipart
Meta Description: Download or customize with your settings this editable pictograph, featuring branches for customizable data and apples symbolizing outcomes.
Tree Infographic Template
Presentation Clipart
Download or customize with your settings this pictograph highlighting global wealth disparity, conveying economic data on rich vs. poor.
World Wealth Distribution Pictograph Template
Presentation Clipart
Download this infographic to visually present data, simplifying complex information and highlighting key performance metrics for easier understanding.
Data Visualization Infographic Template
Presentation Clipart
Download this Medical Matrix Pictograph for a clear statistical analysis of health data, with color-coded icons highlighting varying health statuses.
Medical Matrix Pictograph Template
Presentation Clipart
Customize this clipart template by changing text, images and review stars to show business reputation and attracting new customers.
Customer Review Clipart Design Template
Presentation Clipart
Download or customize this pictograph to illustrate environmental interconnectedness and impact, promoting awareness of sustainable practices.
Environmental Impact Pictographic Template
Presentation Clipart
Download or customize this freshwater usage pictograph, showcasing consumption percentages for agriculture, industry, and domestic use.
Freshwater Usage Pictograph Template
Presentation Clipart
Download this Halloween pictograph to visually represent the popularity of the holiday, using iconic imagery for quick statistical insights.
Halloween Popularity Pictograph Template
Presentation Clipart
Download or customize with your settings this pictograph showing poverty levels across U.S. states. Larger circles reflect higher poverty percentages.
Poverty Line Pictograph Template
Presentation Clipart
Customize this ten-item row pictograph with your settings to visualize fractions and proportions, making complex data easy to understand.
Ten Item Row Pictograph Template
Presentation Clipart
Download or customize this clipart highlighting fraud statistics, showing human figures and a hooded figure at a laptop, with a 40% scam rate.
Pictograph Scam Grid Template
Presentation Clipart
Download or customize this medical quick fact pictograph on hip fractures, visually representing data to highlight the impact on individual autonomy.
Medical Pictograph Template
Presentation Clipart
Download or customize this pictograph highlighting unsolved crime statistics, making complex data on unresolved criminal activity clear and impactful.
Unsolved Crimes Pictograph Template
Presentation Clipart
Customize this four-item matrix pictograph with your settings  for clear data visualization and easy comparison across four categories.
Four Item Matrix Comparison Pictograph Template
Presentation Clipart
Download or customize this pictograph for clear, visually appealing statistical data on transportation modes, distinguished by color-coded icons.
School Transportation Pictograph Template
Presentation Clipart
Download or customize this 'Global Economies' pictograph, comparing countries by GDP, offering a visual analysis of economic power and rankings.
Global Economies Pictograph Template
Presentation Clipart
Download this customer satisfaction pictograph to visually quantify and analyze varying degrees of contentment, highlighting service performance.
Customer Satisfaction Pictographic Template
Presentation Clipart
Customize this 'four row comparison' pictograph  with your settings to visualize data distribution across four categories in one image.
Four Row Comparison Pictograph Template
Presentation Clipart
Download or customize this pizza party pictograph, symbolizing motivation and reward through progress toward a goal in a festive, celebratory way.
Pizza Party Pictograph Template
Presentation Clipart
Download this infographic featuring U.S. diesel fuel prices and annual mileage data, with icons enhancing visual clarity and comprehension.
Fuel Price and Mileage Infographic Template
Presentation Clipart
Download or customize with your settings this pictograph to visualize complex data, highlighting trends and patterns for easy comprehension
Pictograph Template for Data Visualization
Presentation Clipart
Download or customize this American pizza consumption pictograph, showcasing pizza's popularity and versatility in American culture.
American Pizza Consumption Pictograph Template
Presentation Clipart
Download or customize with your settings this pictograph using lemons to simplify and visually present quantitative information clearly and effectively.
Lemonade Sales Representation Pictograph Template
Presentation Clipart
Download or customize this pictograph showing global deforestation with trees transitioning from healthy to barren, emphasizing forest loss.
Global Deforestation Impact Pictograph
Presentation Clipart
Download or customize this pictograph showing global internet access disparity, highlighting regional inequalities in connectivity and digital inclusion.
Global Internet Pictograph Template
Presentation Clipart
Download or customize this restaurant review pictograph for quick, visual customer feedback on dining experiences and key aspects of an establishment.
Restaurant Review Pictograph Template
Presentation Clipart
Download this pictograph to visually represent sales data over time, offering clear insights into trends and comparisons across fiscal periods.
Quarterly Sales Pictograph Template
Presentation Clipart
Download this productivity pictograph template symbolizing time management with an hourglass and balanced icons, emphasizing efficiency.
Productivity Pictograph Template
Presentation Clipart
Download this sunshine pictograph to represent sunlight exposure comparisons, using playful sun icons to simplify complex data.
Sunshine Exposure Pictograph Template
Presentation Clipart
Download or customize this Academic Pencil Pictograph, visually representing educational achievements and challenges with pencil icons and metrics.
Academic Pencil Pictograph Template
Presentation Clipart
Download or customize with your settings this pictograph depicting the balance of power between two major political parties using a scale metaphor.
Political Power Balance Pictograph Template
Presentation Clipart
Customize this  three-item matrix pictograph with your settings to easily compare and analyze data across three categories.
Three Item Matrix Comparison Pictograph
Presentation Clipart
Customize this with your settings this pictograph template, symbolizing balanced comparison or 50/50 distribution between two datasets.
Two Item Matrix Comparison Pictograph
Presentation Clipart
Customize Three-Category Data Pictograph with your settings this to visually represent data distribution across three categories.
Three Category Data Pictograph Template
Presentation Clipart
Customize this ten item row pictograph with your own settings for a visual display of quantities using uniform icons for clarity.
One Row Data Comparison Pictograph Template
Presentation Clipart

It's Time to Let Your Presentations Shine,

Transforming Data into Dynamic Visuals

Enhancing Presentations with Pictographs

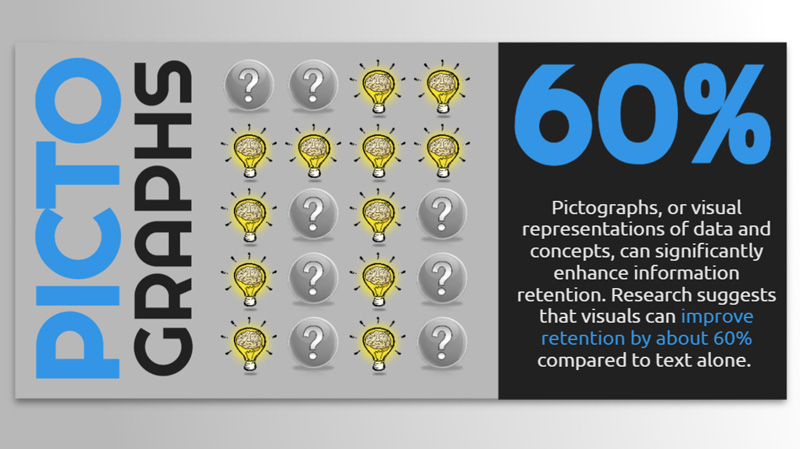
Pictographs can enhance presentations in PowerPoint and Google Slides by simplifying complex information into clear, engaging visuals that capture attention and facilitate understanding. They make data more accessible and memorable, helping to convey key messages with greater impact and clarity.

Ideal for Professionals Across Industries

Who Can Benefit from Pictographs—and How

  • Educators: Pictographs simplify complex concepts, making abstract ideas more accessible and engaging for students. Marketers: Pictographs
  • Marketers: Pictographs enhance visual appeal and clarity, making marketing materials more impactful and memorable.
  • Business Professionals: Pictographs streamline data presentation, improving communication and decision-making by making insights more digestible.
A diverse group of people
Enhance Text with Visual Clarity

Ways Pictographs Enhance Text

  • Improving Comprehension: Visual symbols quickly convey meaning, helping people grasp complex information at a glance.
  • Breaking Up Text: Pictographs make large blocks of text more engaging and easier to digest.
  • Enhancing Memory Retention: Images tend to stick in memory longer than text, making the content more memorable.
A collage of interactive PowerPoint slides with a question mark word cloud

Presentations Made Easy!

Combine pictographs with any of our ready-made, animated PowerPoint templates.

Start delivering presentations that not only wow your audience, but also leave a memorable impact.

PresenterMedia icon guy with a customer service headset on and five stars over it

Frequently Asked Questions About Pictographs

What are pictographs?

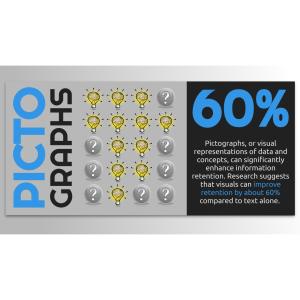
Pictographs are visual representations of data or concepts using icons and illustrations instead of plain text or charts. They're ideal for simplifying complex information in presentations or infographics.

Can I customize the pictographs?

Yes, you can fully customize each pictograph element — including figures, icons, colors, and text — directly in our online pictograph builder.

How can I use pictographs in PowerPoint?

Once you've created your pictograph, you can download it and insert it into PowerPoint as an image. They're perfect for illustrating data, survey results, and educational content.

Can I download pictographs for free?

Yes, a small selection of pictographs is available to download and try for free. No account is required to preview or download these samples.

Is the Pictograph Builder included with membership?

Yes, full access to the custom pictograph tool is included with your PresenterMedia Unlimited Access Membership at no extra cost.

Pictograph Tutorial

Follow along to edit a pictograph template to fit your needs.

Your presentations are going to be amazing! See Plans and Pricing

© 2009-2025 Eclipse Digital Imaging, Inc.

Quality PowerPoint Templates, Animations, videos, and 3D Clipart.
PowerPoint® is a registered trademark of Microsoft Corporation.