X

A professional analyzing financial data on a laptop with vibrant neon lights in the background.
Financial Analysis in Neon
Presentation Clipart
A digital representation of stacked coins on a circuit board, symbolizing finance and technology.
Finance Meets Technology
Presentation Clipart
This image depicts a futuristic digital landscape with upward arrows in blue and red, symbolizing growth and progress.
Digital Growth Background
Presentation Clipart
This image depicts colorful bar graphs representing business performance analytics.
Business Analytics Performance Graphs
Presentation Clipart
A modern digital finance scene with golden coins and a blurred city skyline.
Digital Finance Concept
Presentation Clipart
This video shows an animated arrow moving in up and down trends along a grid chart.
Trends
Video Background
A widescreen presentation slide from graph-chart-trends-pid-7324 preview one.
A widescreen presentation slide from Graph Chart Trends preview two.
A widescreen presentation slide from Graph Chart Trends preview three.
Graph Chart Trends
Template for PowerPoint
A widescreen presentation slide from graph-chart-trends-pid-6061 preview one.
A standard definition presentation slide from Graph Chart Trends preview two.
A standard definition presentation slide from Graph Chart Trends preview three.
A standard definition presentation slide from Graph Chart Trends preview four.
Graph Chart Trends
Template for PowerPoint
Download this future classroom video background learning to visualize a the future of learning.
Future Classroom Motion Video
Video Background
A vibrant digital representation of data analytics with glowing graphs and abstract elements.
Data Analytics Visualization
Presentation Clipart
This clipart image showcases a confrontation between a bear and a bull as it serves as a visual representation of the dynamic nature of the market.
Bull and Bear Market Fierce Standoff
Presentation Clipart
A widescreen presentation slide from business-pie-chart-pid-7591 preview one.
A widescreen presentation slide from Business Pie Chart preview two.
A widescreen presentation slide from Business Pie Chart preview three.
Business Pie Chart
Template for PowerPoint
A widescreen presentation slide from business-pie-chart-pid-405 preview one.
A standard definition presentation slide from Business Pie Chart preview two.
A standard definition presentation slide from Business Pie Chart preview three.
A standard definition presentation slide from Business Pie Chart preview four.
Business Pie Chart
Template for PowerPoint
An image of a three dimensional pie chart with data sheets.
Circular Pie Chart Data Sheet
Presentation Clipart
An image of a large graph with a figure trying to see the future of the market.
Seeing The Future Market
Presentation Clipart
An image of a three dimensional block pie chart with data sheets.
Block Pie Chart Data Sheet
Presentation Clipart
This image features the word "METRICS" against a backdrop of analytical data, emphasizing business analytics.
Business Analytics Metrics Theme
Presentation Clipart
An animation of a circular pie graph on top of some data reports.
Circular Pie Chart Data Up Down
PowerPoint Animation
<p>An image of some data sheets with a magnifying glass looking closer.</p>
Financial Data Zoom In Magnify
Presentation Clipart
An animation of a magnifying glass looking at three dimensional elements on a data sheet.
Financial Data Zoom
PowerPoint Animation
An animation of a magnifying glass looking at the three dimensional financial data sheets.
Financial Data Appearing
PowerPoint Animation
An image of a set of financial data sheets.
Data Financial Sheets
Presentation Clipart
An image with a round pie chart on a white display board.
Financial Pie Chart Board
Presentation Clipart
An image of a red arrow on a chart pointing up.
Financial Graph Increase
Presentation Clipart
An image of an arrow moving up the graph showing an increase in profits.
Arrow Graph Growth
Presentation Clipart
An image of a woman presenting graphical data on a display board.
Woman Chart Data Trend
Presentation Clipart
An image of a stick figure pointing at a three dimensional graph.
Three Dimensional Graph Growth
Presentation Clipart
An image of a stick figure presenting graphical data on a display board.
Stick Figure Chart Data Trend
Presentation Clipart
A dynamic abstract data visualization with yellow and orange elements on a dark background.
Data Visualization Abstract
Presentation Clipart
An animation of a graph and arrow showing an increase in trends.
Three Dimensional Graph Growing
PowerPoint Animation

Download our exclusive video backgrounds to use in your PowerPoint and Keynote presentations or other video projects. Use our customization tool to change the colors in the video background before you download.

Our videos will work in any of our PowerPoint templates.

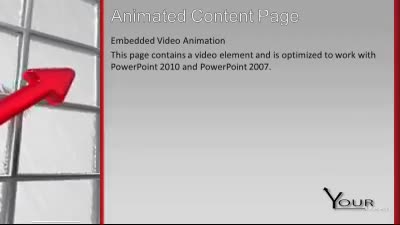
Our video backgrounds will work best in PowerPoint (PC and Mac) versions 2010 or newer or in Keynote. You can download any of our videos as a PowerPoint slide, a Quicktime movie (.mov), or a Window Media Video (.wmv).

Most videos will seamlessly loop using the repeat or loop function in PowerPoint or your favorite software.

Your presentations are going to be amazing! See Plans and Pricing

© 2009-2025 Eclipse Digital Imaging, Inc.

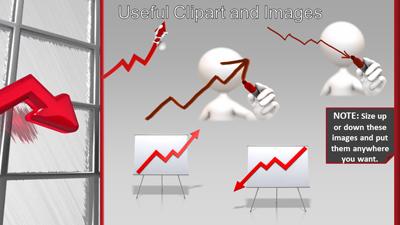
Quality PowerPoint Templates, Animations, videos, and 3D Clipart.
PowerPoint® is a registered trademark of Microsoft Corporation.