Up to 50% OFF

Variations
When you select a layout, the Presentation Builder The Presentation Builder lets you generate or edit AI text, add slides, adjust theme colors, and download your PowerPoint file (works in Google Slides). opens so you can customize the slide and download your PowerPoint file. Watch tutorial
PowerPoint backgrounds are high-quality images you place behind your slide content to instantly theme a presentation for business, education, seasonal topics, and more.
Open Design → Format Background. Choose Picture or texture fill, click Insert to select your image, then choose Apply (current slide) or Apply to All for the whole deck. For default backgrounds on new slides, edit the Slide Master under View.
Yes. In Google Slides, go to Background → Choose image to set it for the current slide or theme. You can also insert the file as a regular image and position it behind content.
Backgrounds download as PNG or JPEG images in multiple sizes (including high-resolution).
Yes, browse a selection of free PowerPoint backgrounds with no sign-up required, or unlock the full library with a membership.
Absolutely. Apply any background to our professional templates to create a cohesive theme across your deck in minutes. Browes our PowerPoint templates to see all themes you could add a PowerPoint background to.
Use sufficient contrast (dark text on light areas or vice versa), add a semi-transparent overlay, and keep busy details away from titles and charts. Adjust image transparency in the Format Background pane if needed.
Yes. Members get unlimited downloads from the full background collection.
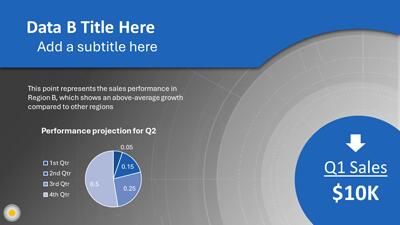
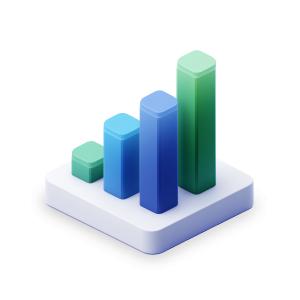
This image features a dynamic and visually striking representation of business analytics. It showcases a series of colorful bar graphs in varying heights, symbolizing performance metrics and data analysis. The bars are illuminated with vibrant colors, including shades of blue, red, and orange, which create a sense of energy and movement. The word "PERFORMANCE" is prominently displayed in bold, three-dimensional letters, reinforcing the focus on analytics and business performance. The background is dark, enhancing the brightness of the bars and adding a modern, tech-inspired feel to the overall composition.
Incorporating this background image into a presentation slide using one of our PowerPoint templates can significantly enhance the visual theme of your message. The vibrant colors and modern design will draw attention and effectively communicate the importance of performance analytics.
You can explore many more PowerPoint backgrounds to create a cohesive visual theme for your presentations, ensuring that your message stands out and resonates with your audience.
business analytics, performance, data visualization, bar graphs, vibrant colors, blue, red, orange, modern design
Similar Templates and Designs
© 2009-2025 Eclipse Digital Imaging, Inc.
Quality PowerPoint Templates, Animations, videos, and 3D Clipart.
PowerPoint® is a registered trademark
of Microsoft Corporation.