Up to 50% OFF
Variations
When you select a layout, the Presentation Builder The Presentation Builder lets you generate or edit AI text, add slides, adjust theme colors, and download your PowerPoint file (works in Google Slides). opens so you can customize the slide and download your PowerPoint file. Watch tutorial
Download the animated GIF from PresenterMedia. In PowerPoint, go to Insert → Pictures → This Device, and select your file. Resize and position it on your slide — it will animate automatically during the slideshow.
Yes. Upload the GIF to your Google Drive. In Google Slides, choose Insert → Image → Drive, then select your animation. It will animate automatically during presentation mode.
Yes. Our animations are available as GIF files, which are widely supported across many platforms. You can insert them into any software that supports animated GIFs, including Microsoft Word, Keynote, Canva, email builders, websites, and most social media platforms. Just download the animation as a GIF and insert it like any standard image.
Use PresenterMedia's animation customizer to change the REPEATS setting to 1 before downloading. This will make the GIF play only once during your presentation.
Animated GIFs are supported in most modern versions of PowerPoint, including PowerPoint 2016 and later. For best results, use in slideshow mode on desktop.
This PowerPoint animation may be included in our free PowerPoint animations section. We offer a limited selection of animations for free so you can try them and see if they fit your design workflow. Visit the PowerPoint animations page and find free animations marked with a green arrow in the top-right corner of each preview thumbnail.
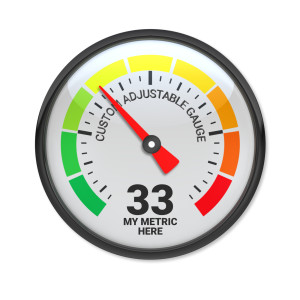
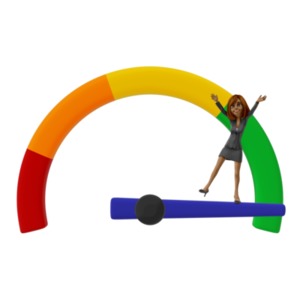
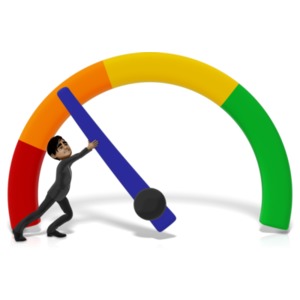
The animated clipart displays a semi-circular gauge with a needle oscillating within the yellow zone, indicating a medium-high power level. The indicator is colored with three distinct zones: red on the left, indicating low power; green on the right, signifying high power; and yellow in the middle, where the needle currently resides.
This gauge metaphorically represents the measurement and monitoring of performance or capacity. The needle's position in the yellow zone suggests that the system is operating above average but not at full capacity. It could imply caution or a need for attention to prevent overloading or to optimize performance. This visual can be an alert to maintain balance and efficiency within a given system.
In science, this image can symbolize experiments where variables are monitored to maintain certain conditions. It might represent assessing student progress or engagement levels during learning activities in education. . It is a universal symbol for tracking progress and maintaining control across various fields.
Add this animation clip to a slide in one of our PowerPoint templates to create an eye-catching visual focal point that enhances your message. The movement of the gauge's needle can draw attention to critical data or trends being discussed. This dynamic element can help emphasize key points and make your presentation more engaging.
An animated gif like this adds dynamic content to media design projects which can make digital interfaces more interactive and engaging. Its movement captures attention more effectively than static images. Its ability to loop seamlessly makes it ideal for continuous display without requiring user interaction.
You can find many more engaging PowerPoint animations for visual aids that enhance your presentations. These animations can help convey complex information in an easily understandable and visually appealing way.
gauge performance monitoring capacity optimization balance efficiency average
Similar Templates and Designs
© 2009-2025 Eclipse Digital Imaging, Inc.
Quality PowerPoint Templates, Animations, videos, and 3D Clipart.
PowerPoint® is a registered trademark
of Microsoft Corporation.