Up to 50% OFF
What Can I Customize?
Customizable clipart lets you modify colors, text, and design elements right in your browser to create graphics tailored to your message and style. It’s perfect for presentations, handouts, websites, and more.
Click the green 'Customize this Item' button above. Then, in the online editor, click the design and select Edit to change text labels, swap colors, reposition elements, and add a logo before downloading. When finished customizing, click Build and Download.
After customizing, download your clipart and insert it into PowerPoint or Google Slides, or upload it into video projects using SlideClips Video Maker. The clipart works in any program that accepts PNG images.
A limited selection is available for free. Full access to all designs and customization features requires a PresenterMedia Unlimited Plan Subscription. Go to the Customizable Clipart page to see all free customizable clipart indicated by the green arrow located in the top right of every preview thumbnail.
Customizable clipart lets you add your own branding, colors, or personal style, making your presentations stand out and feel uniquely yours. It saves time while still giving you creative freedom, helping you connect with your audience in a professional and memorable way.
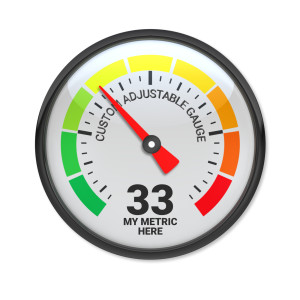
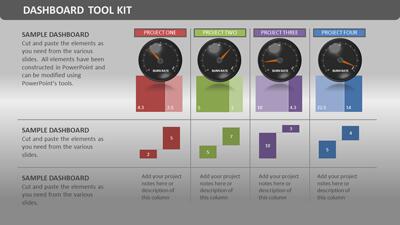
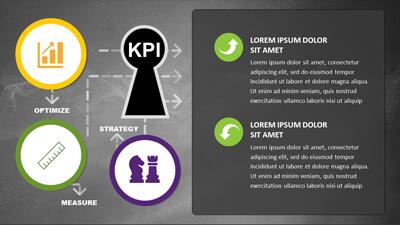
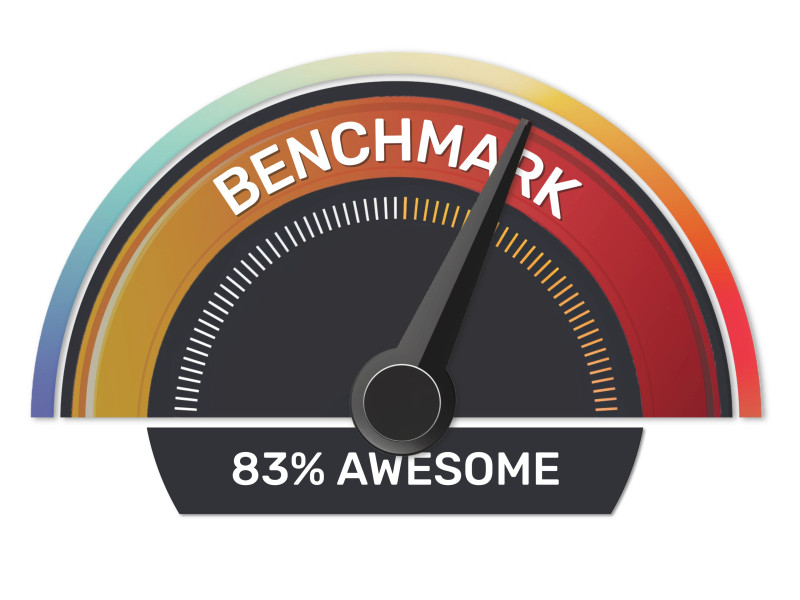
This project template is an editable infographic gauge, currently marked with the placeholder word “BENCHMARK” and indicating “83% AWESOME”. The gauge needle is adjustable and currently points towards the orange section, which is presumably a high rating. The gauge is color-coded with green indicating low, yellow for medium, and red for high performance or ratings. The text on the gauge is customizable, allowing users to adapt it to various contexts and data presentations.
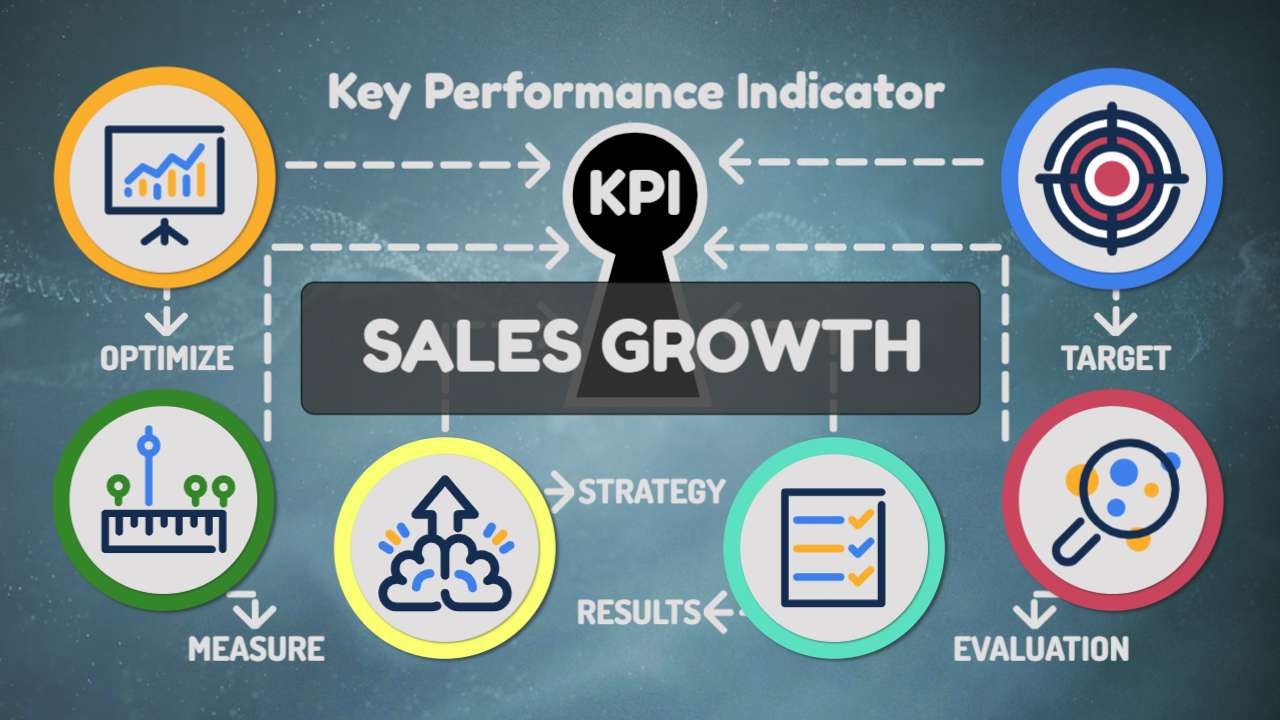
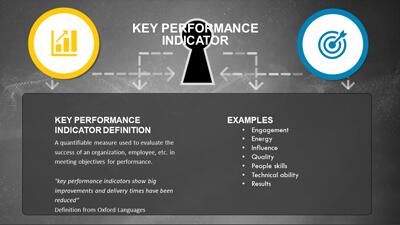
The image represents a dynamic tool for visualizing data in a clear, engaging manner. It can be tailored to represent different metrics or KPIs (Key Performance Indicators), making it a versatile asset for business presentations, academic reports, or informational content where data visualization is key.
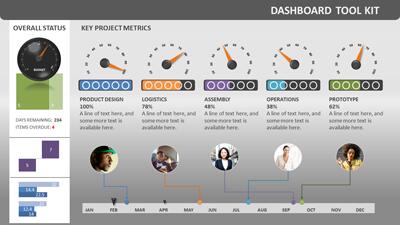
This editable infographic gauge can be seamlessly integrated into one of our PowerPoint templates. Its adaptability ensures that presenters can customize it to reflect specific data points accurately. Here are some ways this image could enhance your presentations:
The transparent PNG background of this editable infographic gauge makes it an excellent resource not just for presentations but also for various media projects and designs. Graphic designers can easily incorporate this element into digital content, print materials, websites, and more. Its customizability ensures that it aligns with different themes and color schemes while conveying data effectively.
You can find many more images like this in our Presentation clipart.
The gauge’s design emphasizes clarity and impact. The bold typography draws attention to the “BENCHMARK” label, while the vibrant orange color signifies achievement. The adjustable needle allows users to highlight specific data points or goals. Whether you’re presenting quarterly sales figures, project milestones, or employee performance reviews, this gauge provides a visually compelling way to communicate progress and success.
For designers and media creators, the transparent PNG format is a game-changer. It seamlessly integrates into various design software, allowing for easy customization. Imagine using this gauge in an infographic about environmental sustainability, where the needle represents progress toward renewable energy goals. Or incorporate it into a website dashboard to visualize user engagement metrics. The possibilities are vast.
Remember, this editable gauge isn’t just a static image—it’s a dynamic tool that adapts to your needs. So, whether you’re crafting a presentation, designing marketing materials, or enhancing a blog post, leverage this gauge to convey information effectively and engage your audience.
gauge infographic benchmark key performance indicator KPI metric result meter custom text
Similar Templates and Designs
© 2009-2025 Eclipse Digital Imaging, Inc.
Quality PowerPoint Templates, Animations, videos, and 3D Clipart.
PowerPoint® is a registered trademark
of Microsoft Corporation.