Up to 50% OFF

Variations
When you select a layout, the Presentation Builder The Presentation Builder lets you generate or edit AI text, add slides, adjust theme colors, and download your PowerPoint file (works in Google Slides). opens so you can customize the slide and download your PowerPoint file. Watch tutorial
PowerPoint backgrounds are high-quality images you place behind your slide content to instantly theme a presentation for business, education, seasonal topics, and more.
Open Design → Format Background. Choose Picture or texture fill, click Insert to select your image, then choose Apply (current slide) or Apply to All for the whole deck. For default backgrounds on new slides, edit the Slide Master under View.
Yes. In Google Slides, go to Background → Choose image to set it for the current slide or theme. You can also insert the file as a regular image and position it behind content.
Backgrounds download as PNG or JPEG images in multiple sizes (including high-resolution).
Yes, browse a selection of free PowerPoint backgrounds with no sign-up required, or unlock the full library with a membership.
Absolutely. Apply any background to our professional templates to create a cohesive theme across your deck in minutes. Browes our PowerPoint templates to see all themes you could add a PowerPoint background to.
Use sufficient contrast (dark text on light areas or vice versa), add a semi-transparent overlay, and keep busy details away from titles and charts. Adjust image transparency in the Format Background pane if needed.
Yes. Members get unlimited downloads from the full background collection.
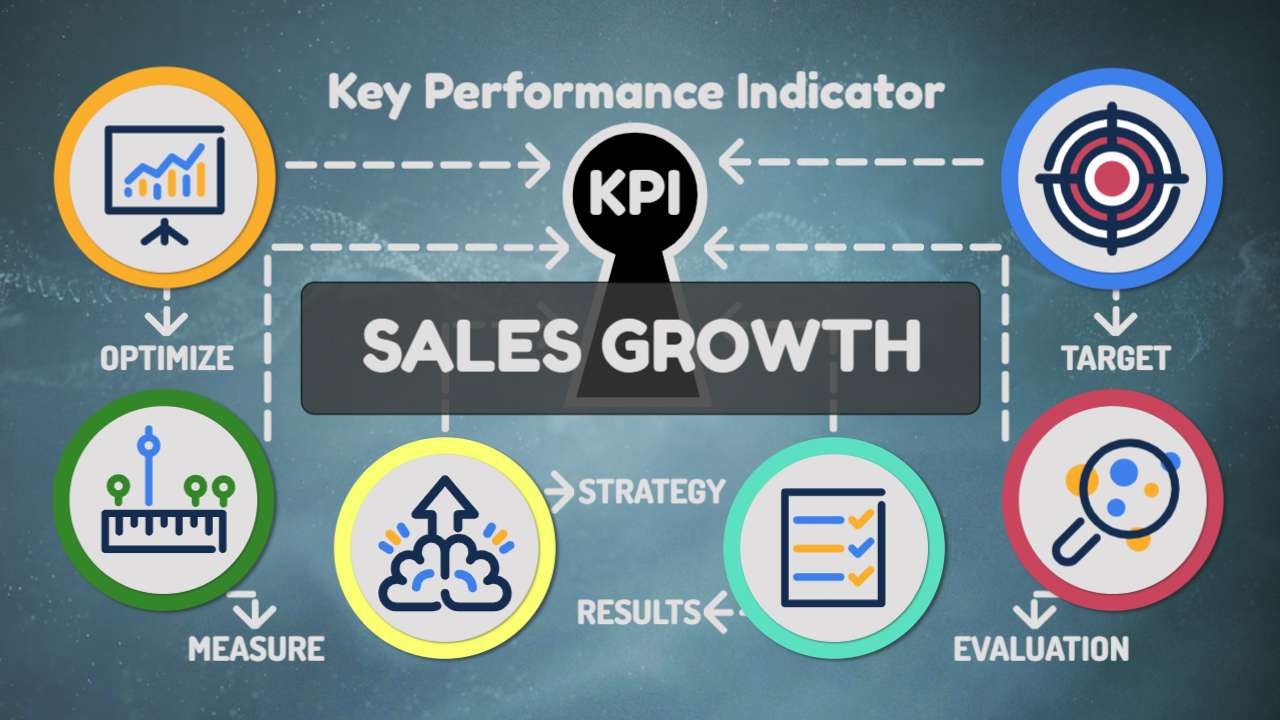
This background image features a data analytics PowerPoint background with business metrics and charts, designed to visually represent performance tracking and strategic insights. The centerpiece of the image is the bold word "METRICS", emphasized by a magnifying glass that symbolizes close analysis and data-driven decision-making. Surrounding the focal point are vibrant, colorful visuals—including bar graphs, pie charts, and line graphs—that depict various types of business analytics and KPIs.
This performance dashboard presentation background for business analytics slides is perfect for themes focused on data analysis, growth strategy, and operational performance. Whether you're showcasing quarterly results, pitching a new analytics tool, or educating a team on metrics interpretation, this background creates an impactful and cohesive visual environment for your message.
Incorporating this data visualization slide background for PowerPoint into one of our PowerPoint templates enhances your presentation's professionalism while aligning your content with a strong analytics theme. The combination of metrics and graphical elements ensures clarity and engagement for your audience.
Explore our complete collection of PowerPoint backgrounds to find additional designs that support your presentations on data, business growth, and strategic performance management.
business metrics, analytics, data visualization, graphs, charts, performance indicators
Similar Templates and Designs
© 2009-2025 Eclipse Digital Imaging, Inc.
Quality PowerPoint Templates, Animations, videos, and 3D Clipart.
PowerPoint® is a registered trademark
of Microsoft Corporation.