Up to 50% OFF
What Can I Customize?
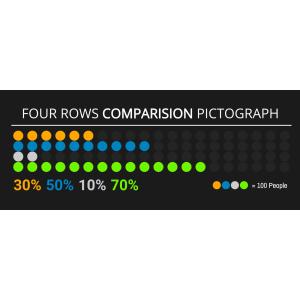
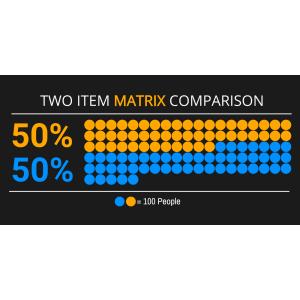
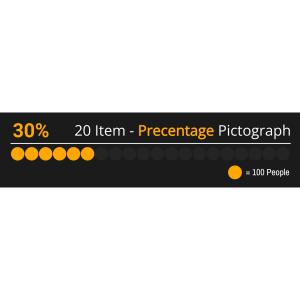
A pictograph is a simple data visualization that uses repeated icons to represent quantities. PresenterMedia pictographs are fully editable graphics you can customize online and download as high-quality images for slides, documents, or the web.
Open the online editor to edit values, labels, and text. Choose your icon style, adjust colors or layout, and when finished, click the Build and Download button to generate your customized image.
Yes. Select an icon set and click Edit. Under the Format Pictograph panel, use the paintbrush tool to adjust icon colors. You can also control how many icons are filled to reflect your values.
Absolutely. Update the quantities, click Update, and the pictograph will instantly adjust to match your changes.
Your customized pictograph downloads as a high-resolution PNG images. Perfect for use in presentations, documents, websites, or print.
Yes. Simply insert the PNG image into any slide like a regular picture. It scales cleanly and displays exactly as designed.
A limited selection is available for free. Full access to all pictographs and advanced customization features is included with a PresenterMedia Unlimited Plan Subscription.
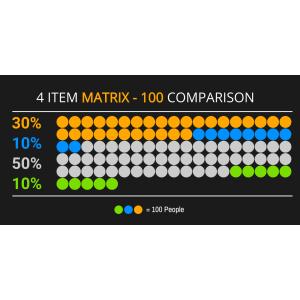
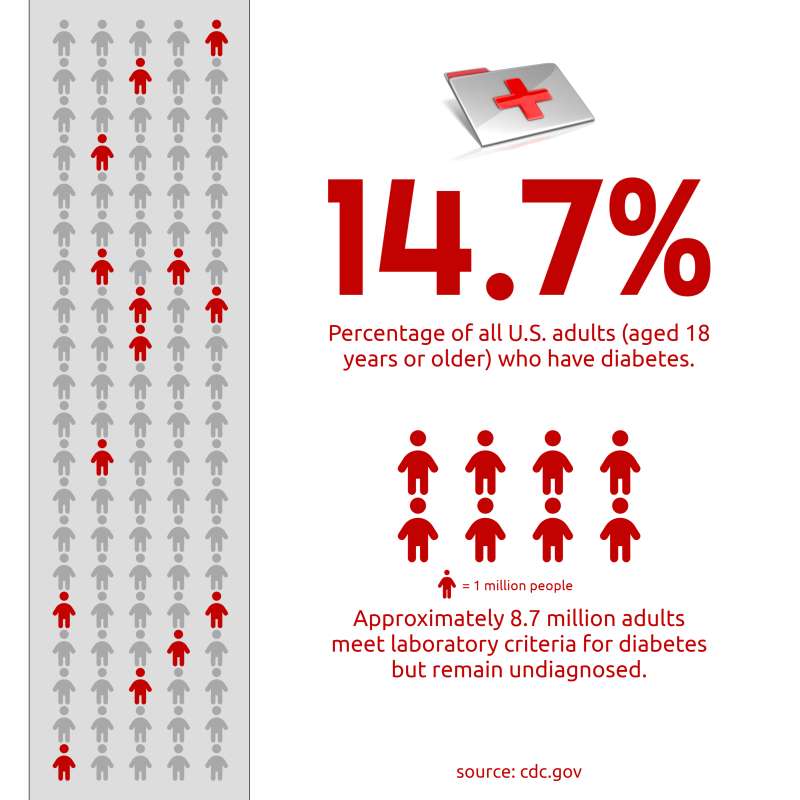
The image displays a pictograph template titled "Medical Matrix," which consists of multiple rows of icons representing individuals. Each row contains ten icons for seven rows; six are grey, and one has one red icon, indicating a different status or condition.
By clicking on the 'Customize This Item' button above, you have numerous options at your disposal: change text content according to your needs; add images that enhance your message, delete elements that are not relevant; or access the pictograph editor to change the icons, increase/decrease icons, and adjust the layout. This flexibility ensures the pictograph can be tailored to fit your presentation or design requirements.
This Medical Matrix Pictograph could represent a statistical analysis or visual representation of data in the medical field. The varying colors among the icons suggest differentiation in health status, with the red icon possibly highlighting an individual with a specific condition amidst others.
This infographic is a visual tool for representing health data, making complex information more accessible. It can illustrate the prevalence of certain medical conditions within a population. The red icon emphasizes a particular statistic or condition, highlighting critical data points. This approach aids in quickly conveying important health information to diverse audiences.
The image indicates how data can be visually represented to convey information about health statistics. The percentage mentioned, "14.7%", alongside the statement that it represents U.S. adults with diabetes, provides context to the pictograph's purpose. The additional text informs that approximately 8.7 million adults meet laboratory criteria for diabetes but remain undiagnosed, emphasizing the significance of awareness and diagnosis in healthcare. This pictograph is an illustrative tool to effectively communicate these figures to an audience, potentially aiding in understanding and decision-making within medical communities.
Adding this clipart image to a slide in one of our PowerPoint templates can create a visual focal point to accompany the presentation slide message. It helps break down complex data into easily understandable visuals, which can enhance audience engagement and retention of the presented information.
This image's transparent PNG background makes it highly versatile for various media design projects. By clicking on the background layer's visibility in the layers tab, designers can seamlessly integrate this pictograph into different backgrounds without any conflicting visuals. This feature allows for clean and professional incorporation into broader design schemes..
You can find many more standout Pictographs for visual aids that can enhance your presentations and reports. These pictographs are designed to convey information clearly and effectively. They are perfect for making your data presentations more impactful and memorable.
pictograph medical matrix pictograph health data statistical health status
Similar Templates and Designs
© 2009-2025 Eclipse Digital Imaging, Inc.
Quality PowerPoint Templates, Animations, videos, and 3D Clipart.
PowerPoint® is a registered trademark
of Microsoft Corporation.