Up to 50% OFF
What Can I Customize?
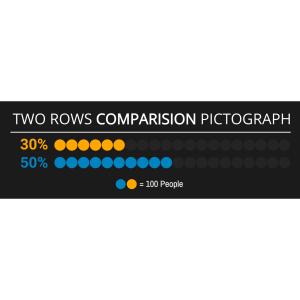
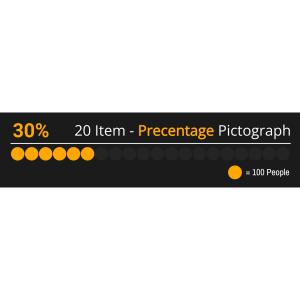
A pictograph is a simple data visualization that uses repeated icons to represent quantities. PresenterMedia pictographs are fully editable graphics you can customize online and download as high-quality images for slides, documents, or the web.
Open the online editor to edit values, labels, and text. Choose your icon style, adjust colors or layout, and when finished, click the Build and Download button to generate your customized image.
Yes. Select an icon set and click Edit. Under the Format Pictograph panel, use the paintbrush tool to adjust icon colors. You can also control how many icons are filled to reflect your values.
Absolutely. Update the quantities, click Update, and the pictograph will instantly adjust to match your changes.
Your customized pictograph downloads as a high-resolution PNG images. Perfect for use in presentations, documents, websites, or print.
Yes. Simply insert the PNG image into any slide like a regular picture. It scales cleanly and displays exactly as designed.
A limited selection is available for free. Full access to all pictographs and advanced customization features is included with a PresenterMedia Unlimited Plan Subscription.
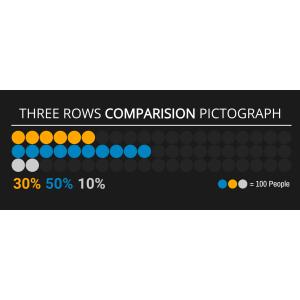
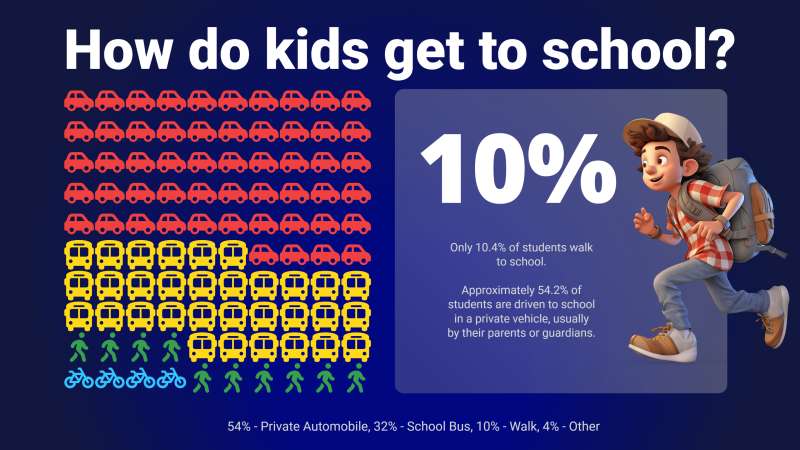
This editable pictograph displays a variety of transportation methods used by students to get to school, represented by colorful icons. There are rows of icons depicting buses, cars, and a singular icon of a student walking, with percentages indicating the proportion of each transportation method used.
The pictograph is visually appealing and easy to understand, making it an effective tool for conveying statistical information. The icons are neatly arranged, and using different colors helps distinguish between the various modes of transportation.
By clicking the Customize This Item button above, you can change text, add an image, delete elements, or access the pictograph editor to change the icons, add or decrease icons, and change the layout. This flexibility allows you to tailor the pictograph to fit your needs, making it a powerful tool for personalized presentations and reports.
This school transportation pictograph visually represents the distribution of different modes of transport students use to commute to school. It highlights the predominance of specific methods over others, potentially reflecting infrastructural and societal trends. The percentages associated with each mode could indicate efficiency levels or accessibility issues within the school's locality. This visual data can be crucial for policymakers and educational institutions when considering improvements in student transport facilities.
This image encapsulates more than how students arrive at their place of learning; it is a snapshot of community logistics, economic factors, and environmental impact. The high percentage shown for bus usage suggests an organized system that may be cost-effective and less polluting than individual car rides. Conversely, the lower rate for walking could raise questions about urban planning and safety in proximity to schools. This pictograph serves as a tool for educators and administrators to assess and discuss transportation's role in daily education logistics. By analyzing this data, schools can make informed decisions to enhance student safety and promote sustainable transportation options. Additionally, it can foster discussions on how to improve infrastructure to support more students walking or biking to school, thereby promoting healthier lifestyles.
Adding this clipart image to a slide in one of our PowerPoint templates can create a visual focal point to accompany the presentation slide message. It helps to break down complex data into easily digestible visuals, making your presentation more engaging. This can be particularly useful in educational settings where visual aids enhance understanding.
The transparent PNG background feature makes this image versatile for various media design projects where it can seamlessly integrate with other elements without any background clashes. By clicking the visibility of the background layer in the layers tab; designers can easily remove or reinstate the background according to their project needs—making it ideal for creating clean-looking educational materials or digital content.
You can find many more standout Pictographs for visual aids. These pictographs are designed to make your data presentations more impactful and visually appealing. Explore our collection to find the perfect visual aid for your next project.
pictograph transportation statistics data
Similar Templates and Designs
© 2009-2025 Eclipse Digital Imaging, Inc.
Quality PowerPoint Templates, Animations, videos, and 3D Clipart.
PowerPoint® is a registered trademark
of Microsoft Corporation.