Up to 50% OFF
What Can I Customize?
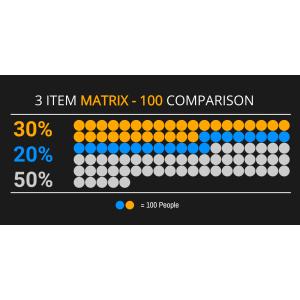
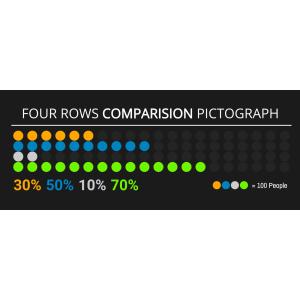
A pictograph is a simple data visualization that uses repeated icons to represent quantities. PresenterMedia pictographs are fully editable graphics you can customize online and download as high-quality images for slides, documents, or the web.
Open the online editor to edit values, labels, and text. Choose your icon style, adjust colors or layout, and when finished, click the Build and Download button to generate your customized image.
Yes. Select an icon set and click Edit. Under the Format Pictograph panel, use the paintbrush tool to adjust icon colors. You can also control how many icons are filled to reflect your values.
Absolutely. Update the quantities, click Update, and the pictograph will instantly adjust to match your changes.
Your customized pictograph downloads as a high-resolution PNG images. Perfect for use in presentations, documents, websites, or print.
Yes. Simply insert the PNG image into any slide like a regular picture. It scales cleanly and displays exactly as designed.
A limited selection is available for free. Full access to all pictographs and advanced customization features is included with a PresenterMedia Unlimited Plan Subscription.
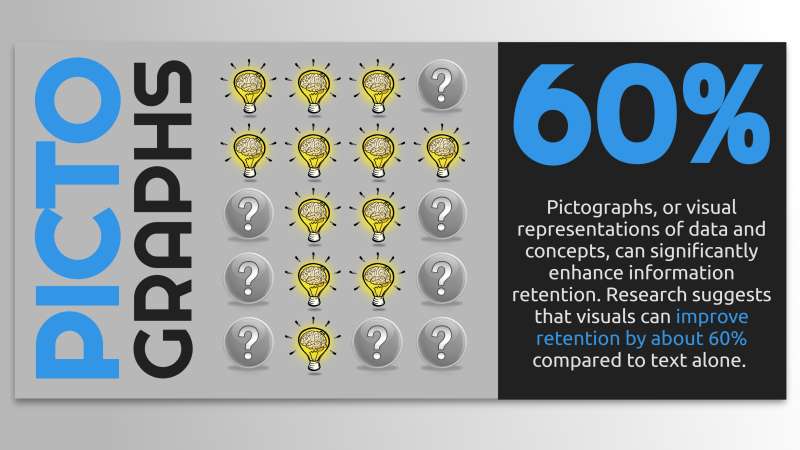
The image displays a pictograph template with the title "PICTOGRAPHS" in bold blue letters on the left side. It features a row of light bulbs, five illuminated, and four dimmed, next to a significant percentage figure "60%" on the right side.
If you click on the 'Customize This Item' button above, you can access numerous customization options. You can change text content, add your own image elements, delete parts you don't need, or access the pictograph editor to change the icons, increase/decrease icons, and change the layout. This flexibility ensures that the pictograph can be tailored to fit your specific needs and preferences.
Pictographs are visual tools that translate data and concepts into easily understandable images. They enhance cognitive retention by simplifying complex information, making it more accessible and memorable for viewers.
Pictographs represent data visually, making it easier to comprehend and analyze. They can convey complex information quickly and effectively. By using images to represent data points, pictographs can highlight trends and patterns that might be missed in text-based data. This makes them a powerful tool for communication and education.
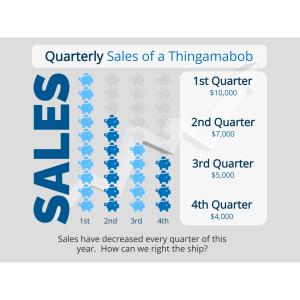
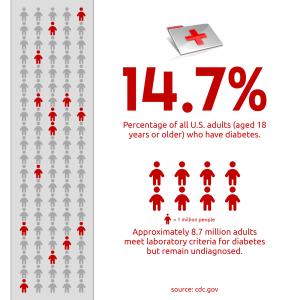
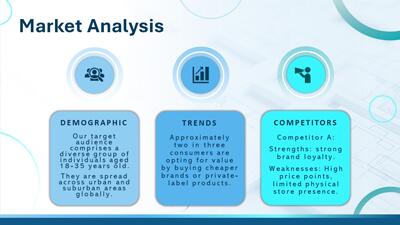
In educational settings, pictographs are used to represent statistical data visually to aid in learning and retention. In marketing, they grab attention quickly and convey messages succinctly to potential customers. For businesses, pictographs can summarize performance metrics or survey results at a glance during presentations or reports. They serve as powerful communication tools across various domains by distilling information into digestible visual formats.
Adding this clipart image to a slide in one of our PowerPoint templates can create a visual focal point to accompany the presentation slide message. It helps to break up text-heavy slides and keeps the audience engaged. The visual representation of data can make complex information more digestible and memorable.
This pictograph is a template designed for customization. It provides a starting point for users to edit according to their specific needs by replacing images, altering text, and changing the overall theme. The flexibility of this template allows it to be adapted for various contexts and audiences. Its design is intentionally generic so that it can be tailored to fit any presentation or report's unique requirements.
A transparent PNG background is highly beneficial in media design projects because it allows for seamless integration into different designs without any unwanted backgrounds clashing with existing elements. This versatility makes it ideal for layering over other images or placing onto colored backgrounds while maintaining the integrity of the original design elements within the pictograph itself.
You can find many more standout Pictographs for visual aids. These pictographs enhance your presentations, reports, and marketing materials. They provide a visually appealing way to present data and concepts.
pictograph data visualization trends patterns analysis communication education
Similar Templates and Designs
© 2009-2025 Eclipse Digital Imaging, Inc.
Quality PowerPoint Templates, Animations, videos, and 3D Clipart.
PowerPoint® is a registered trademark
of Microsoft Corporation.