Up to 50% OFF
What Can I Customize?
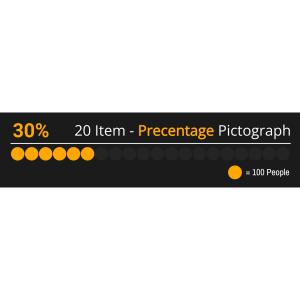
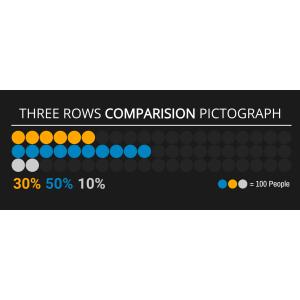
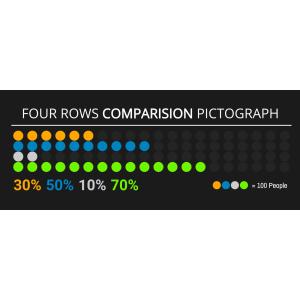
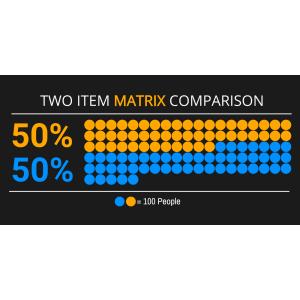
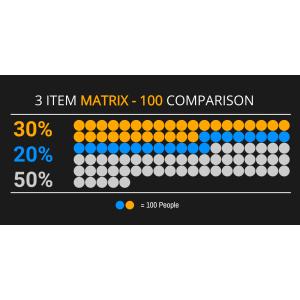
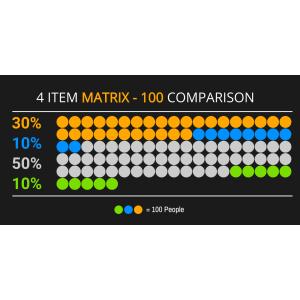
A pictograph is a simple data visualization that uses repeated icons to represent quantities. PresenterMedia pictographs are fully editable graphics you can customize online and download as high-quality images for slides, documents, or the web.
Open the online editor to edit values, labels, and text. Choose your icon style, adjust colors or layout, and when finished, click the Build and Download button to generate your customized image.
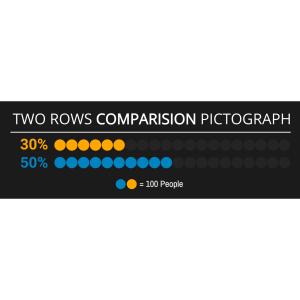
Yes. Select an icon set and click Edit. Under the Format Pictograph panel, use the paintbrush tool to adjust icon colors. You can also control how many icons are filled to reflect your values.
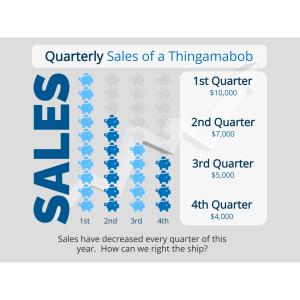
Absolutely. Update the quantities, click Update, and the pictograph will instantly adjust to match your changes.
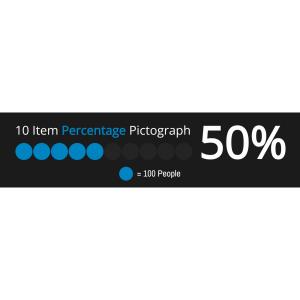
Your customized pictograph downloads as a high-resolution PNG images. Perfect for use in presentations, documents, websites, or print.
Yes. Simply insert the PNG image into any slide like a regular picture. It scales cleanly and displays exactly as designed.
A limited selection is available for free. Full access to all pictographs and advanced customization features is included with a PresenterMedia Unlimited Plan Subscription.
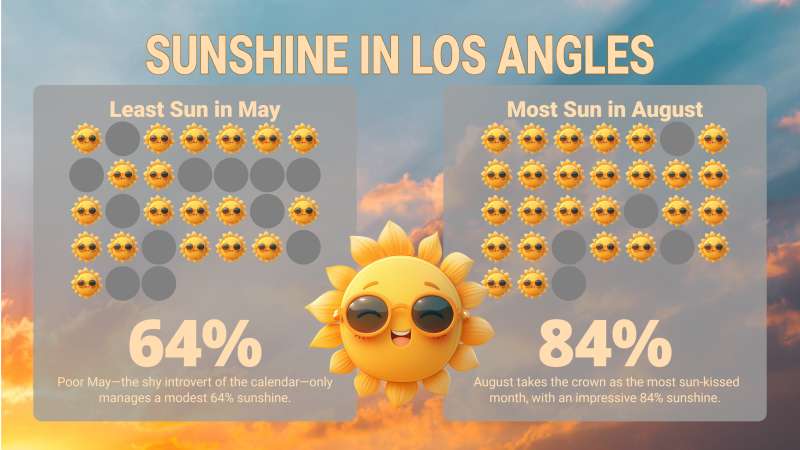
This image features a "Sunshine in Los Angeles" pictograph set against a backdrop of a sunrise or sunset with clouds. The pictograph displays two sets of icons representing the sun, with one side labeled "Least Sun in May," showing fewer sun icons and a percentage of 64%, and the other labeled "Most Sun in August," showing more sun icons and 84%.
By clicking the Customize This Item button above, you can change text, add an image, delete elements, or access the pictograph editor to change the icons, add or decrease icons, and change the layout. This feature allows you to tailor the pictograph to better fit your needs and preferences. Whether you need to adjust the data representation or personalize the design, the customization options provide great flexibility.
This sunshine pictograph could represent a comparative analysis of sunlight exposure during different months. It visually communicates the increase or decrease in sunny days, which can be essential for various industries like agriculture or tourism. The use of dynamic sun icons adds an element of playfulness to the data presentation, making it more engaging for viewers. This visual representation helps simplify complex data into an easily digestible format.
In terms of weather, this image represents the variation in sunshine between May and August in Los Angeles, indicating that August experiences more sunny days. This information is crucial for travel and vacation planning as it suggests that tourists might prefer visiting during months with higher sunshine percentages for outdoor activities. It also implies potential implications for seasonal businesses that thrive on tourist influx during sunnier months. Additionally, it could influence residents' daily activities and energy consumption patterns based on sunlight availability.
Adding this clipart image to a slide in one of our PowerPoint templates can create a visual focal point to accompany the presentation slide message. It helps make the data more engaging and accessible for the audience to understand, and the pictograph's visual appeal can enhance your presentation's overall impact.
This image's transparent PNG background makes it highly versatile for media design projects. It allows designers to overlay the pictograph onto various backgrounds without unsightly borders, ensuring seamless integration into different designs. This flexibility is beneficial when creating multi-layered compositions or placing the image over complex patterns where a solid background would be disruptive. To remove the background > Go into the layers tab and turn off the layer.
You can find many more standout Pictographs for visual aids that can elevate your presentations. These pictographs are designed to simplify complex data and make your slides more visually appealing. Explore our collection to find the perfect visual aids for your next project.
pictograph weather sunshine sunlight exposure comparison data travel
Similar Templates and Designs
© 2009-2025 Eclipse Digital Imaging, Inc.
Quality PowerPoint Templates, Animations, videos, and 3D Clipart.
PowerPoint® is a registered trademark
of Microsoft Corporation.