Up to 50% OFF
What Can I Customize?
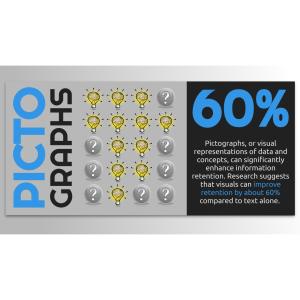
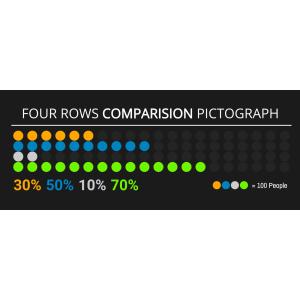
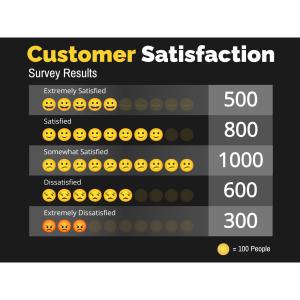
A pictograph is a simple data visualization that uses repeated icons to represent quantities. PresenterMedia pictographs are fully editable graphics you can customize online and download as high-quality images for slides, documents, or the web.
Open the online editor to edit values, labels, and text. Choose your icon style, adjust colors or layout, and when finished, click the Build and Download button to generate your customized image.
Yes. Select an icon set and click Edit. Under the Format Pictograph panel, use the paintbrush tool to adjust icon colors. You can also control how many icons are filled to reflect your values.
Absolutely. Update the quantities, click Update, and the pictograph will instantly adjust to match your changes.
Your customized pictograph downloads as a high-resolution PNG images. Perfect for use in presentations, documents, websites, or print.
Yes. Simply insert the PNG image into any slide like a regular picture. It scales cleanly and displays exactly as designed.
A limited selection is available for free. Full access to all pictographs and advanced customization features is included with a PresenterMedia Unlimited Plan Subscription.
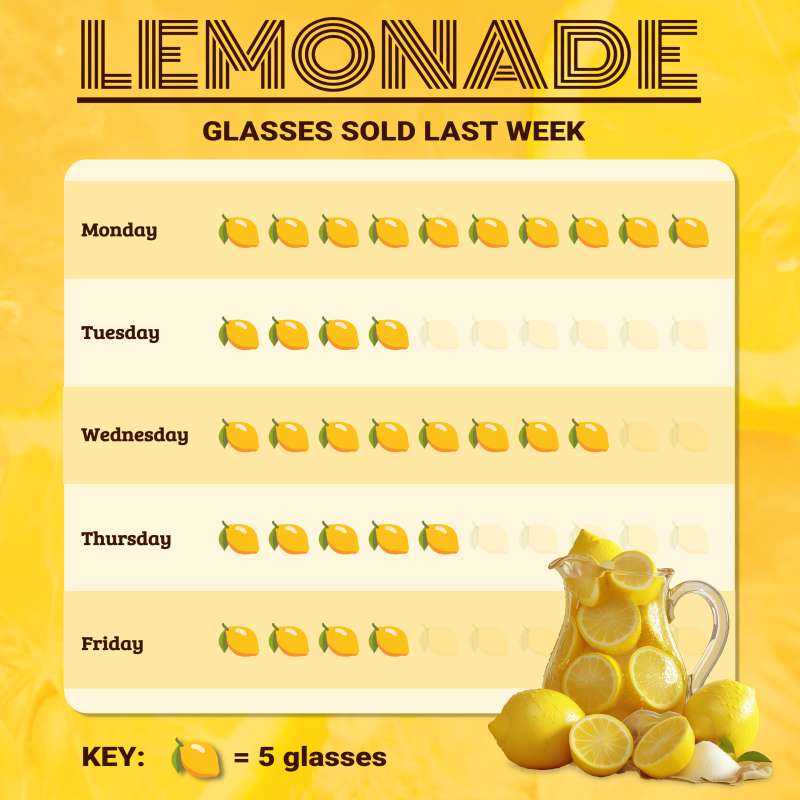
The editable pictograph displays a "Lemonade Glasses Sold Last Week" pictograph with rows labeled for each day of the week, Monday through Friday. Each row contains a series of lemon icons, where one lemon icon represents five glasses of lemonade sold.
This pictograph conveys quantitative information using a simple and visually engaging method. Using lemons as icons directly associates the data with the product being sold. You can update this pictograph using your product.
By clicking the ‘Customize This Item’ button above, you can change text, add an image, delete elements, or access the pictograph editor to change the icons, add increase/decrease icons, and change the layout. This feature allows you to tailor the pictograph to better fit your specific needs and preferences. Whether you need to adjust the data representation or align the design with your brand's aesthetics, the customization options provide high flexibility.
This pictograph represents a simple and visually engaging method to convey quantitative information. The use of lemons as icons in this context is symbolic, directly associating the data with the product being sold. It simplifies complex data into an easily interpretable visual format, making it accessible to a wide audience. This type of representation can be particularly effective in situations where quick comprehension is necessary.
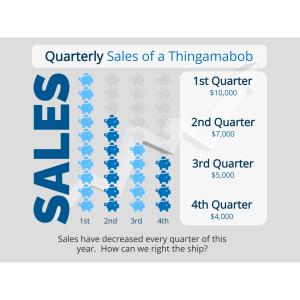
In sales and marketing contexts, this image serves as an illustrative tool to showcase product performance over some time. It provides immediate insight into sales trends, highlighting peak and low sale days that can inform future business strategies. The pictograph's visual nature allows for quick comparison between different days, offering an at-a-glance evaluation that can be crucial in fast-paced environments. Additionally, it serves as an aesthetically pleasing way to present data that might otherwise be dry or overlooked if presented in traditional tabular form.
Adding this clipart image to a slide in one of our PowerPoint templates can create a visual focal point to accompany the presentation slide message. It helps break down complex data into an easily digestible format, making your presentation more engaging. The visual appeal of the pictograph can capture the audience's attention and enhance the overall impact of your message.
This image with a transparent PNG background is handy in media design projects. It allows for seamless integration into various backgrounds without additional editing. This flexibility makes it ideal for creating visually appealing graphics for websites, social media, and promotional materials. The transparent background ensures the pictograph can be layered over other design elements without any visual disruption.
You can find many more standout Pictographs for visual aids. These pictographs simplify data presentation and make your content more engaging. Explore our collection to find the perfect visual aid for your next project.
pictograph quantitative sales marketing lemonade visual data
Similar Templates and Designs
© 2009-2025 Eclipse Digital Imaging, Inc.
Quality PowerPoint Templates, Animations, videos, and 3D Clipart.
PowerPoint® is a registered trademark
of Microsoft Corporation.