
Using Smart Art PowerPoint Graphic Designs
Do you ever feel like your PowerPoint slides are a little too...plain? Maybe you're looking for a way to jazz them up without going overboard? If so, then you'll want to check out the world of smart art diagrams. Smart art is a great way to add visual interest to your slides, and there are plenty of options to choose from. In this blog post, we'll take a look at some of the best SmartArt diagrams for PowerPoint, and we'll show you how to use them. Let's get started!
Want more ways to upgrade your slides? Browse our collection of PowerPoint templates featuring built-in SmartArt layouts and editable diagrams.
This blog post will explore six key points about smart art diagrams.
1. What are Smart Art diagrams in PowerPoint.
2. How to create a Smart Art diagram.
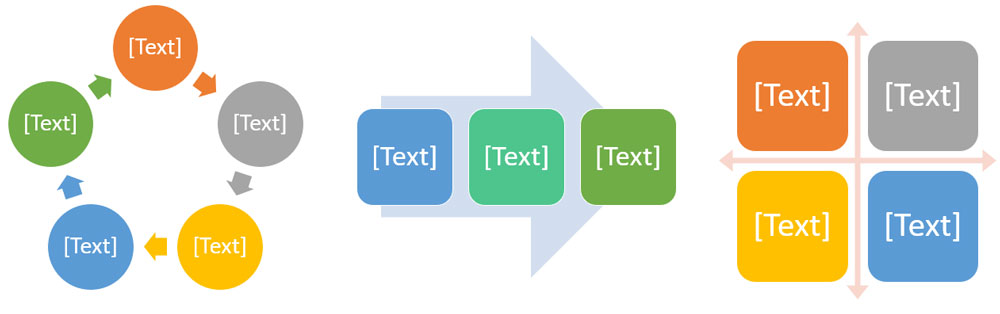
3. The different types of Smart Art diagrams.
4. Tips for using your new diagram effectively.
5. Ways to edit the text inside the diagram.
6. Examples of how you might use this type of diagram in an actual presentation or report.
So, what exactly are smart art diagram designs in PowerPoint?
SmartArt is a built-in PowerPoint feature that allows you to create professional-looking diagrams with just a few clicks. They also make it easy to create professional-looking slides that convey complex information in an easily understandable manner. They're easy to use - select the one from the many options that best fits your data, and start typing! Next, we will explore how to create a Smart Art diagram.
So, You've learned what they are, now let's create a Smart Art diagram.
Here are some easy-to-follow steps on making and editing Smart Art in PowerPoint.
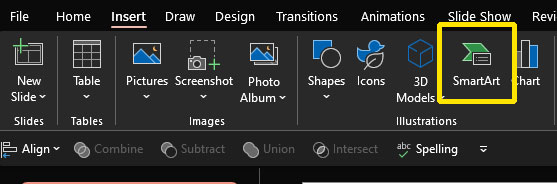
1. Select Insert from the top PowerPoint menu. Then, click on SmartArt from the Insert options.
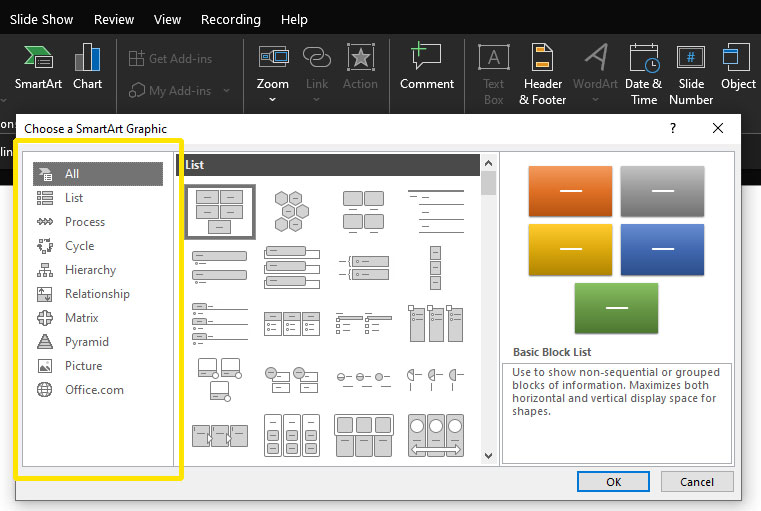
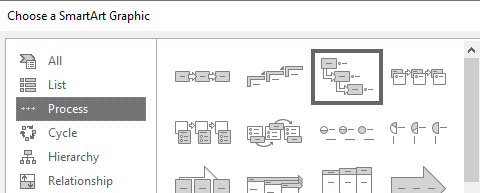
2. The SmartArt option window will now open. The menu highlighted in yellow contains all the diagram categories to choose from, and the middle window shows all the layouts available for that category.
3. For this example, I will use a layout from the process category. I'm choosing an arrow process that shows three steps.
Below is the list of categories to choose from:
- Diagram lists to show points.
- Cycle charts to show continuation flow.
- Process flow to chart data along a timeline.
- Pyramid level to show the importance of information.
- Diagram layouts to compare the relationship of data.
- Matrix charts to map out sections of information.
- Diagram layouts provide picture inserts.
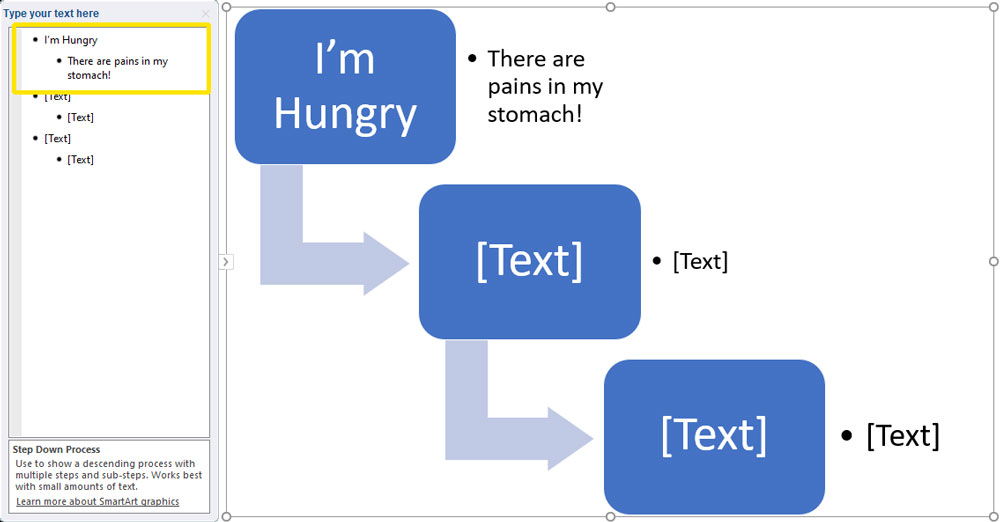
4. With the process diagram now loaded, click to change the text areas on the left menu bar. A yellow box shows the text in the blue box and the description to the left. Add your text here, and it will update in the diagram instantly.
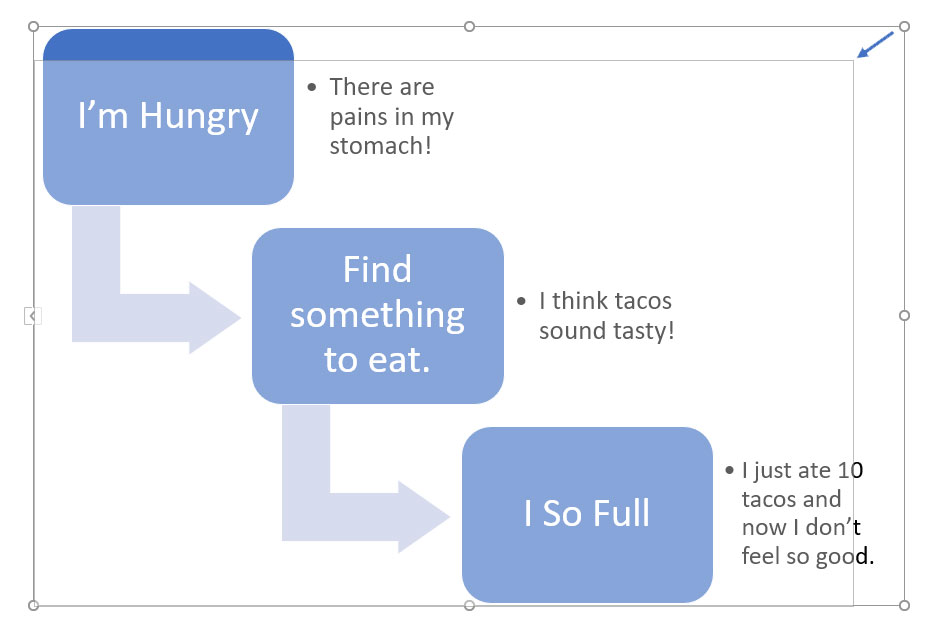
5. At this time, or any other time, you can choose to resize the diagram if desired. To do this, click to select the diagram, then click, hold, and drag the corner point of the selection box out or in to make it smaller or bigger. If you hold down the Shift key on your keyboard as you resize, it will lock the shape of the diagram.
6. Okay, let's look at how to customize the process diagram further. With the SmartArt diagram selected, go to the top menu bar and select (SmartArt Design).
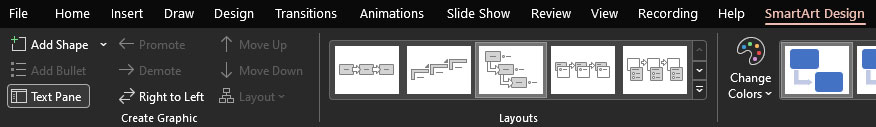
You will now see all the smart art sections create graphics, layouts, smart art styles, and reset. Let's explore the options in those sections and see what they all do.
Create Graphics Section:
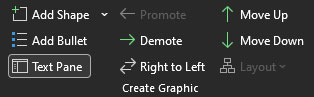
- The first option in this Section is the add shape button. When you click this, PowerPoint will add another shape. For this list diagram, you see it add another blue shape containing the same text placeholders as in the previous shapes.
- The next option we look at is the Text Pane. This option simply shows or hides the text menu bar for the diagram.
- The following options control the position of the elements in the diagram. With a component inside the diagram, you choose to move up / move down to reposition where you want it along the chain. Select the (Right to Left) option to flip the diagram. The (Demote) option will eliminate the element and add your text to the previous component of the chain.
- Also, with an element selected, you can choose (Add Bullet) to insert another bullet point for that diagram element.
Diagram Layouts Section:
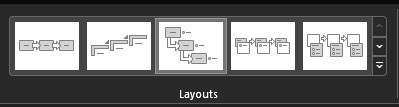
- In this Section, a menu to change the layout of your diagram. Changing the design from here will not delete your text but add it into the new design you choose.
SmartArt Style Section:
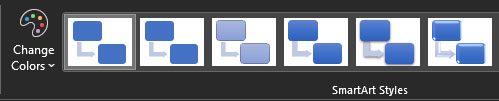
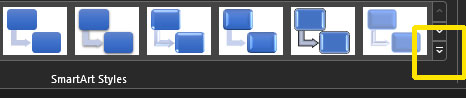
- This Section allows choosing visually how your diagram will look. With seven visible preset options, click a look, and your chart will update. To access more presets, click on the tiny drop-down arrow.
- You can change the color of the diagram pretty quickly. Click on change colors on the left side of the styles section.
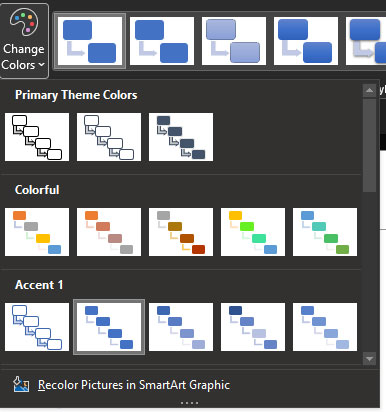
- These colors are linked to the theme colors in PowerPoint. For information on that, see a video explaining more about PowerPoint theme colors.
Reset Diagram Section:
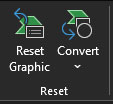
- This section is where you reset your diagram to its original settings. Note, doing this will not erase the text but revert the diagrams options that have changed.
- The last option is the Convert drop-down, which allows you to convert your diagram to just text or turn it into PowerPoint shapes. If you choose the Convert to Shapes option, you can right-click on the design and Ungroup all the elements. The main reason I see for doing this would be to animate the shapes in a way you can't do with it as a SmartArt diagram.
What are the best ways to use SmartArt on your presentation slides?
1. Use SmartArt to organize your slides into sections.
2. Create a hierarchy of importance using different shapes and colors.
3. Add text boxes that display important information.
4. Make sure you have an introduction slide to let people know what they are looking at.
5. Include a summary or conclusion slide at the end, summing up all the main points made in your presentation.
6. Include one Powerful visual element to accompany your graph. This element could be a photo, animation, or clipart image. Exploring the PresenerMedia Clipart and Animations will help you track down a perfect piece to incorporate with your SmartArt design.
7. Add a simple abstract slide design or abstract background video to enhance your design.
8. Easily create a new slide and add SmartArt to any of our PresenterMedia Powerpoint templates using the new skills you have learned.
This is the end, what do you do now?
You've learned how to create a Smart Art diagram, so now the next step is deciding what type of layout you want. Do you need an organizational chart? Or would it be better for your report if you had a timeline? There are many different types of diagrams that can help present information in meaningful ways, and each one will work best depending on the subject matter at hand. Learn more about how PowerPoint diagrams can help make your presentations better. If you would like to view animated PowerPoint digrams and charts check out our PowerPoint Diagrams templates.
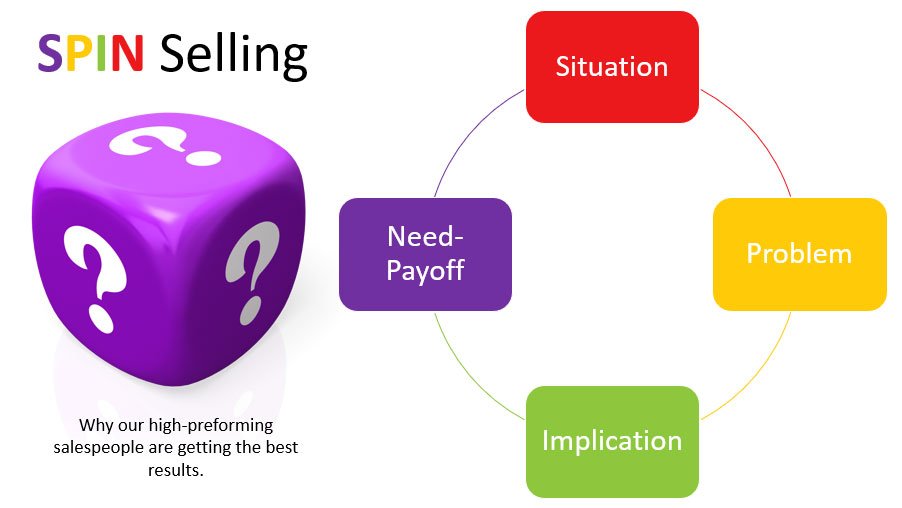
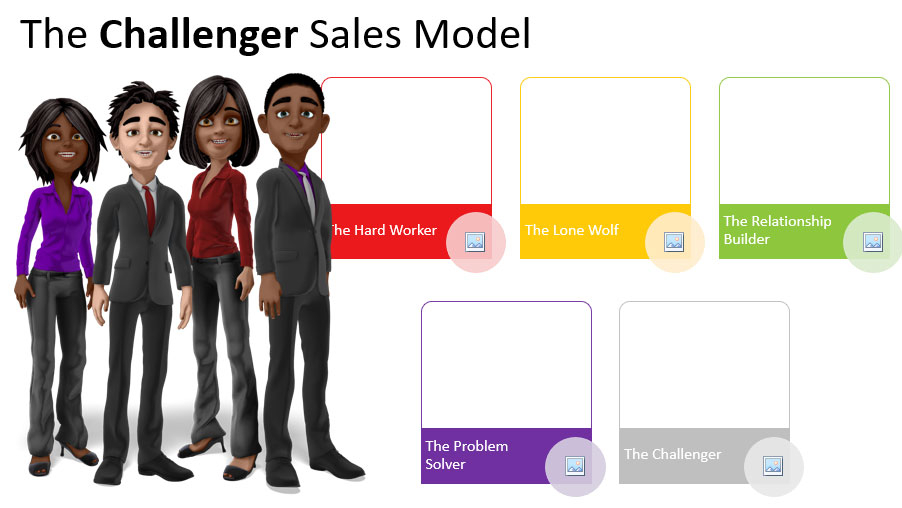
Check out two examples below to see some possibilities for slides you can create by combining this powerful PowerPoint SmartArt tool with engaging PresenterMedia graphics.


Blog Comments (Sign In to Comment):