Up to 50% OFF
What Can I Customize?
Customizable clipart lets you modify colors, text, and design elements right in your browser to create graphics tailored to your message and style. It’s perfect for presentations, handouts, websites, and more.
Click the green 'Customize this Item' button above. Then, in the online editor, click the design and select Edit to change text labels, swap colors, reposition elements, and add a logo before downloading. When finished customizing, click Build and Download.
After customizing, download your clipart and insert it into PowerPoint or Google Slides, or upload it into video projects using SlideClips Video Maker. The clipart works in any program that accepts PNG images.
A limited selection is available for free. Full access to all designs and customization features requires a PresenterMedia Unlimited Plan Subscription. Go to the Customizable Clipart page to see all free customizable clipart indicated by the green arrow located in the top right of every preview thumbnail.
Customizable clipart lets you add your own branding, colors, or personal style, making your presentations stand out and feel uniquely yours. It saves time while still giving you creative freedom, helping you connect with your audience in a professional and memorable way.
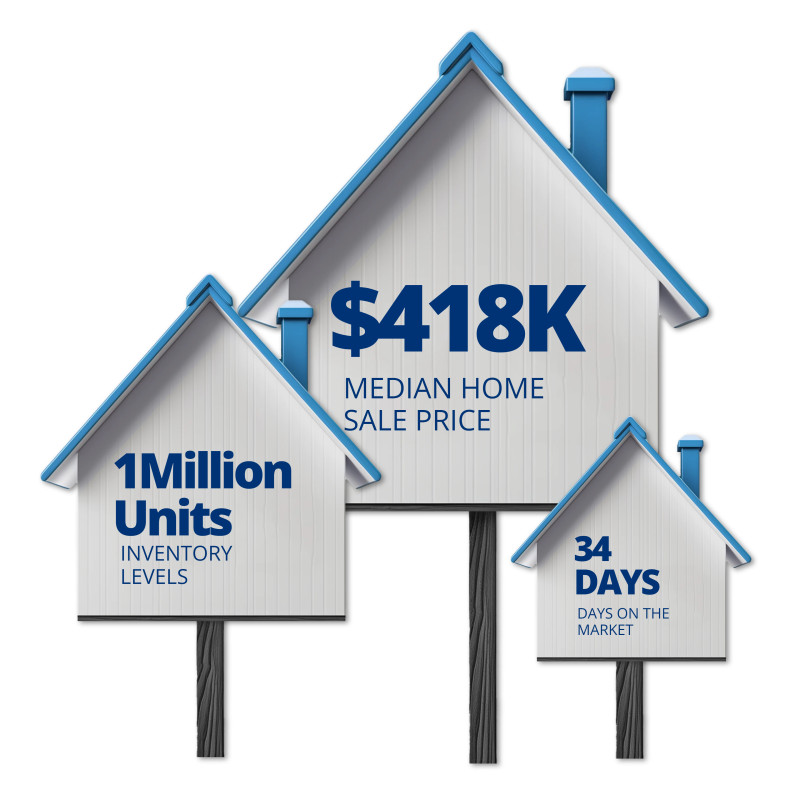
This clipart image, titled "Real Estate Infographic," features three house-shaped elements, each displaying different data related to the real estate market. The largest house in the center shows a median home sale price, while the smaller houses on either side display inventory levels and an average of days on the market.
By clicking on 'Customize this Item', customers have an array of options for personalization. They can change text labels according to specific data sets or terminologies relevant to their presentation context. Adding logos or other branding elements is easy; users can also delete elements that may not be necessary for their specific usage scenario, ensuring that each infographic is as relevant and impactful as possible.
The image represents key metrics crucial for understanding current trends in the real estate market. It visually communicates the median sale price, inventory levels, and how long properties typically stay on the market. This infographic offers a quick snapshot of these metrics for easy comprehension. The use of house shapes not only makes the data visually appealing but also contextually relevant.
This Real Estate Infographic can be a valuable asset in presentations to convey complex data in a simplified and engaging manner. Here are some ways it might be incorporated:
Add this Real Estate Infographic to a slide in one of our PowerPoint templates to create a visual focal point that accompanies your presentation slide message. The combination of data-driven visuals and concise information will engage your audience effectively.
An image with a transparent PNG background like this Real Estate Infographic offers versatility in media design projects. It allows designers to seamlessly integrate complex data visuals into various backgrounds without any border disruptions, ensuring aesthetic consistency across different media platforms. The clarity and precision of information presentation make such images invaluable tools for professionals looking to enhance visual communication effectively.
For many more standout Presentation Clipart options, explore our collection to find the perfect visual aids for your next presentation.
real estate market trends housing key metrics infographic data visualization
Similar Templates and Designs
© 2009-2025 Eclipse Digital Imaging, Inc.
Quality PowerPoint Templates, Animations, videos, and 3D Clipart.
PowerPoint® is a registered trademark
of Microsoft Corporation.